There is a peculiar habit in contemporary political and social commentary: Find a troubling statistic, attach a moral conclusion and assume the argument is finished.
It works because numbers feel like facts, and moral conclusions feel like justice. Put them together and you get something that sounds unanswerable. Who argues with a percentage?
I do. Not because the numbers are always wrong. Often they’re perfectly accurate. I argue because an accurate number is where an investigation begins, not where it ends.
A statistic describes what happened. It does not explain why it happened, who is to blame or what should be done about it. Those take evidence, definitions, comparisons and judgment. The habit I’m describing skips all four.
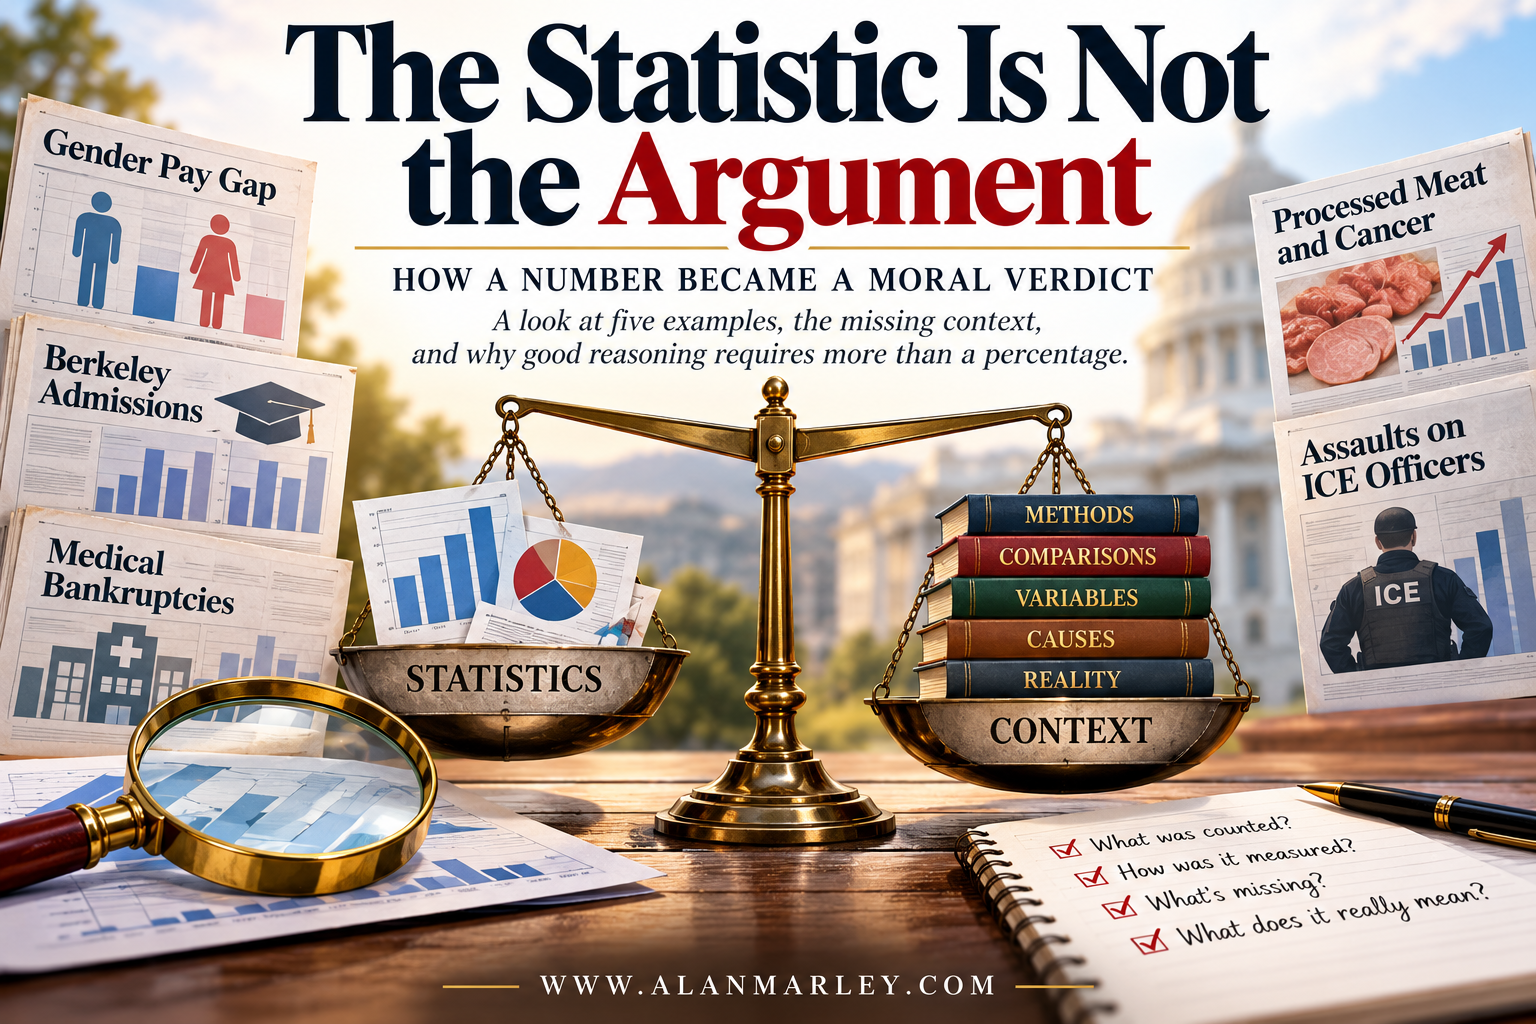
Here are five examples. Some come from the left. Some come from the right. The error is the same.
The Pay Gap: Real Number, Missing Explanation
Women earn about 77 to 80 cents on a man’s dollar, depending on whether you compare annual or weekly earnings of full-time workers. The figure is real. [7]
The moral conclusion arrives instantly: employers pay women less for the same work.
But the same economists who document the gap have shown how much of it moves when you ask better questions. Francine Blau and Lawrence Kahn found that controlling for education and experience, women earn about 82 percent of what men earn. Add occupation and industry and the figure climbs to about 92 percent. [2, 7]
That is not the end of the story. Blau herself calls the remaining gap sizeable, and discrimination cannot be ruled out. But it does mean the headline number mixes together very different things: what women and men are paid for the same job, which jobs they hold, how many hours they work and which interruptions they face.
Each one is a separate argument with a separate remedy. Treat them as one and you will fix none of them.
Berkeley: When the Numbers Told the Truth and Still Misled
In the fall of 1973, the University of California, Berkeley received 12,763 applications to its graduate programs. About 44 percent of the men who applied were admitted. About 35 percent of the women were. That is a nine-point gap, and the statistical test said it was too large to be chance. [1]
The conclusion wrote itself. The university discriminated against women.
Then researchers did what the headline did not. They looked at the departments. Department by department, four showed a statistically significant bias against women. Six showed a bias against men. Pooled correctly, the data showed a small but significant tilt in favor of women. [1]
What happened? Women applied in larger numbers to the departments that were hardest to get into. The pooled number reflected where they applied, not how they were treated.
This is the famous case of Simpson’s paradox, and it has a lesson for every debate that starts with a single aggregate figure. The number can be exactly right and the story attached to it exactly wrong.
Medical Bankruptcy: Two Numbers That Can’t Both Mean What We Say
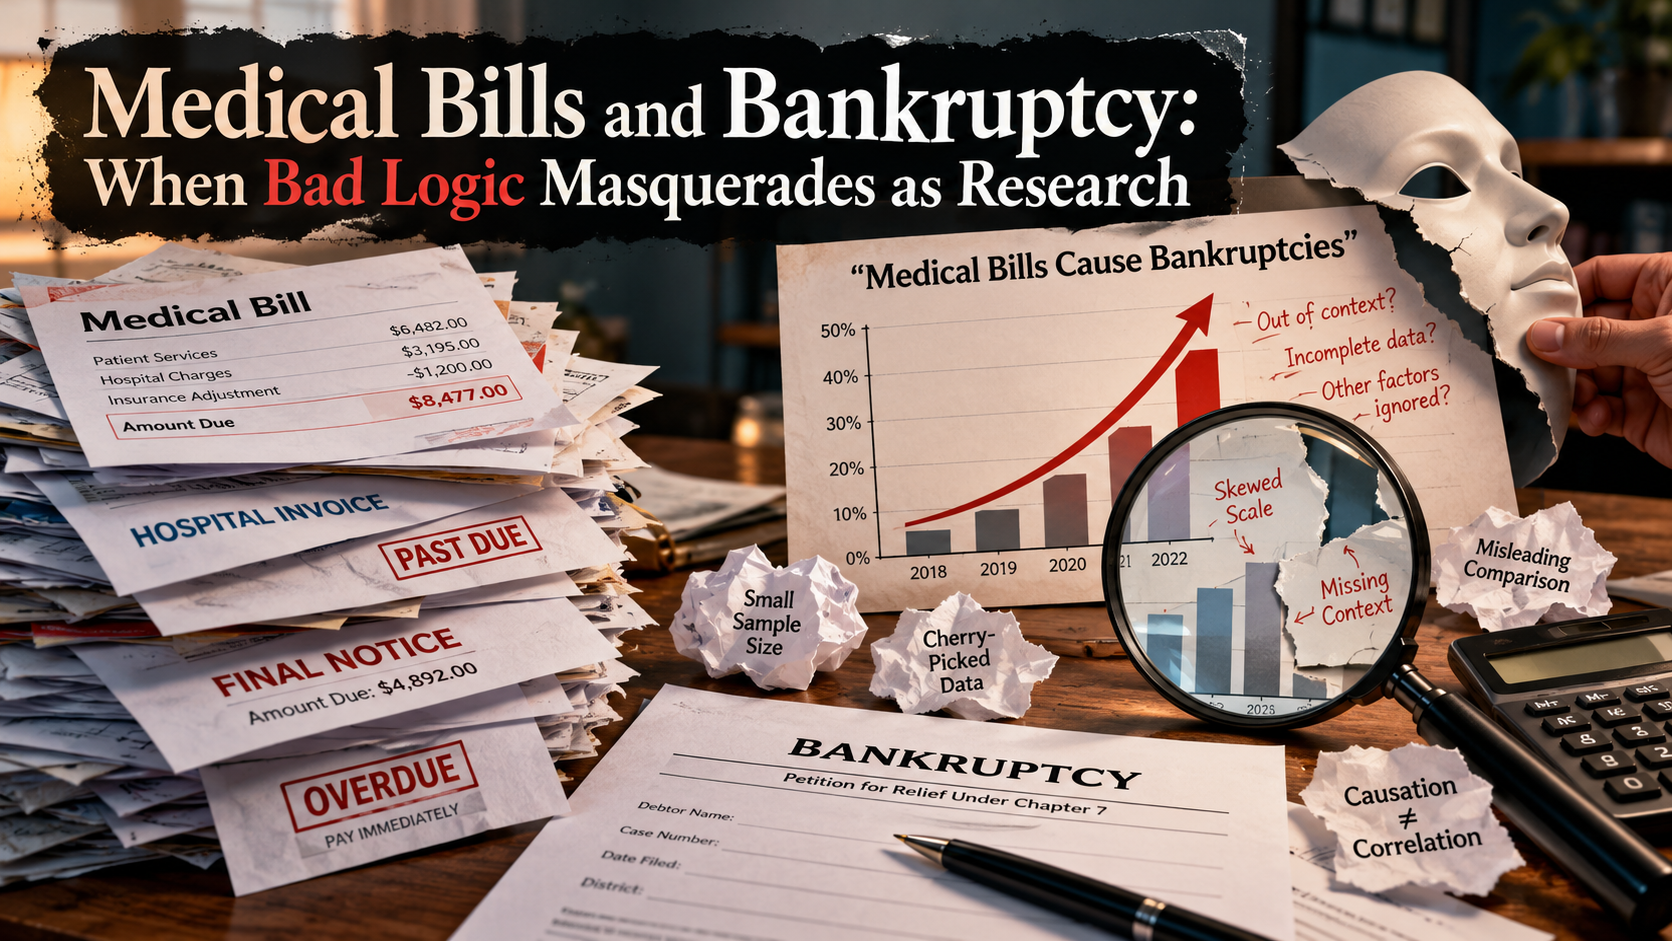
A widely cited 2009 study reported that 62.1 percent of American bankruptcies were medically related. The moral conclusion followed: illness bankrupts the country. [5]
The definition of “medically related” was broad. It included people with large medical bills, but also people who lost income because of illness. Those are different mechanisms with different fixes.
A later study by economists Carlos Dobkin, Amy Finkelstein, Raymond Kluender and Matthew Notowidigdo followed hospital admissions through credit records. It found that hospitalizations accounted for roughly 4 percent of bankruptcies among nonelderly adults in its sample. [4, 6]
Neither study is useless. They measure different things. One counts every medical connection. The other tests whether a specific event changed the outcome. Pick whichever number flatters your politics and you have an argument. Ask what each one measures and you have an education.
Bacon: Relative Risk Without the Baseline
In 2015, the World Health Organization’s cancer agency classified processed meat as carcinogenic to humans. The widely repeated figure was that eating 50 grams a day raised the risk of colorectal cancer by 18 percent. [3]
Eighteen percent sounds like a one-in-five chance of cancer. It isn’t. It is a relative increase. The lifetime risk of colorectal cancer is about 5 percent, or 1 in 20. An 18 percent increase on 5 percent is roughly 6 percent. The agency itself said the individual risk remains small. [3]
That is still worth knowing. It is not the same as a headline that treats bacon like cigarettes, and the researchers said so. The category label put processed meat in the same classification as smoking. It did not put it in the same league.
A relative number with no baseline tells you the direction. It does not tell you the size.
The Percentage With No Starting Point
The same trick shows up on the other side of the aisle.
The Department of Homeland Security announced that assaults on ICE officers had risen more than 1,150 percent. [8]
A percentage increase is only as informative as the number it starts from. A jump from 10 incidents to 120 is a 1,100 percent increase. So is a jump from 1,000 to 12,000. One is a small problem that grew. The other is a very large one. The percentage cannot tell you which.
The political conclusion is easy to attach: sanctuary politicians are fueling violence. That may or may not be true. The percentage alone cannot prove it, because it does not show the count, the definition of an assault or how reporting changed over the same period.
If you wouldn’t accept that logic from the other side, don’t accept it from yours.
Compared to what? A number without a baseline is a mood, not a measurement.
Measured how? The definition decides the result. Change it and the number changes.
What else could explain it? Look for the variable that was left out.
How big is it in absolute terms? A large percentage of a tiny number is still tiny.
Where the Statistic Is Right
None of this means statistics don’t matter. They matter enormously. A real disparity is a signal that something may be wrong, and ignoring it because it is politically inconvenient is its own kind of dishonesty.
The pay gap is real. Medical bills do bankrupt families. Processed meat does raise risk. Assaults on officers are a serious matter. In every case the number deserves an answer.
But an answer is something you earn with evidence. The number only asks the question.
Why This Matters
When a statistic becomes a verdict, three things happen. The people who agree stop thinking. The people who disagree stop listening. And the real problem, whatever it is, stays unsolved because nobody has bothered to find out what it is.
A free society depends on people who can tell a measurement from a conclusion. It is a skill worth teaching, and it costs nothing to practice. Ask what the number counts. Ask what it leaves out. Then ask who benefits from you not asking.
- Bickel, P. J., Hammel, E. A., & O’Connell, J. W. (1975). Sex bias in graduate admissions: Data from Berkeley. Science, 187 , 398-404.
- Blau, F. D., & Kahn, L. M. (2017). The gender wage gap: Extent, trends, and explanations. Journal of Economic Literature, 55 (3), 789-865. https://doi.org/10.1257/jel.20160995
- Canadian Grocer. (2015). Processed meats linked to cancer, says WHO. canadiangrocer.com
- Dobkin, C., Finkelstein, A., Kluender, R., & Notowidigdo, M. J. (2018). The economic consequences of hospital admissions. American Economic Review, 108 (2), 308-352. https://doi.org/10.1257/aer.20161038
- Himmelstein, D. U., Thorne, D., Warren, E., & Woolhandler, S. (2009). Medical bankruptcy in the United States, 2007: Results of a national study. American Journal of Medicine, 122 (8), 741-746. https://doi.org/10.1016/j.amjmed.2009.04.012
- MIT News. (2018, March 21). How often do medical problems lead to bankruptcy? news.mit.edu
- PBS NewsHour. Three economists think they know Equal Pay Day. pbs.org/newshour/economy/three-economist-think-know-equal-pay-day
- U.S. Department of Homeland Security. Statement on increase in assaults against ICE officers. dhs.gov