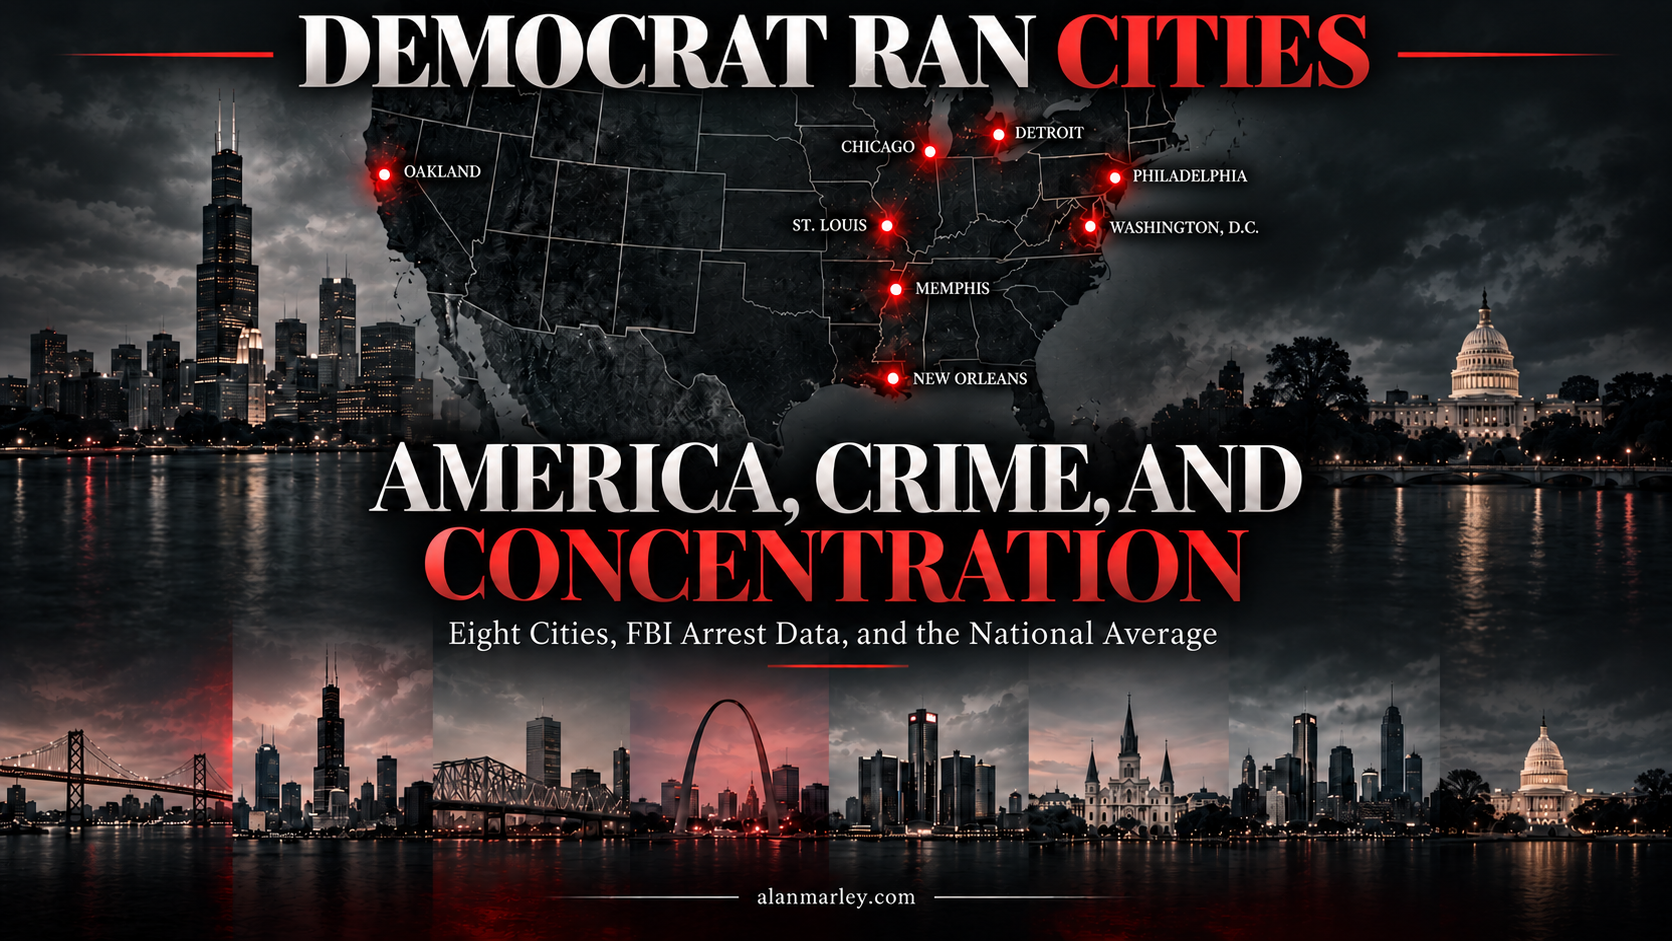
This table uses 2019 rather than a more recent year because 2019 is the last full reporting year before the FBI's 2021 shift to NIBRS-only submission caused a significant drop in agency participation, several large cities, New Orleans among them, have had incomplete or delayed FBI submissions in the years since. Two cities below, Philadelphia and Washington, D.C., could not be confirmed against a clean, explicitly-dated 2019 figure and are marked accordingly rather than filled with an estimate.
| City | 2019 Murders | Murder Rate /100k | Violent Crime Rate /100k |
|---|---|---|---|
| Chicago, IL | 503 | 18.7* | n/a |
| Memphis, TN | 190 | ~29 | 1,901 |
| Philadelphia, PA | n/a | n/a | n/a |
| Oakland, CA | 78 | 17.97 | 1,272 |
| St. Louis, MO | 194 | ~53 | 1,927 |
| Detroit, MI | n/a | 41.45 | 1,965 |
| Washington, D.C. | n/a | n/a | n/a |
| New Orleans, LA | 121 | 30.7 | 1,145 |
* Chicago's murder rate is my own calculation: 503 homicides (Chicago Sun-Times police-data count for 2019) divided by the city's approximate 2019 population, not an FBI-published city rate. Memphis and St. Louis murder rates are approximate, derived from the murder count against 2019 population; the underlying counts (190 and 194) are directly reported. Detroit's murder rate and Chicago's, Memphis's and St. Louis's violent crime rate totals come from a single compiled ranking source rather than the FBI's own city table, since I could not access the FBI's 2019 Table 8 city-level workbook directly. Philadelphia and Washington, D.C. are marked n/a because no source I could verify reported a clean, full-year 2019 figure rather than a partial-year or multi-year blended number.
Who Governs These Cities
All eight cities are currently led by Democratic mayors. Three names below differ from earlier lists circulating online: St. Louis, Detroit and New Orleans have all changed leadership since 2025. The last column shows something more striking than any single mayor's name: how long unbroken Democratic control has actually run.
| City | Mayor | Party | In Office Since | Last GOP Mayor |
|---|---|---|---|---|
| Chicago, IL | Brandon Johnson | Democratic | May 15, 2023 | 1931 (95 yrs) |
| Memphis, TN | Paul Young | Democratic | January 1, 2024 | ~1967 (~59 yrs)* |
| Philadelphia, PA | Cherelle Parker | Democratic | January 2, 2024 | 1952 (74 yrs) |
| Oakland, CA | Barbara Lee | Democratic | May 20, 2025 | ~1960s (~65 yrs)* |
| St. Louis, MO | Cara Spencer | Democratic | April 2025 | 1949 (77 yrs) |
| Detroit, MI | Mary Sheffield | Democratic | January 1, 2026 | 1962 (64 yrs) |
| Washington, D.C. | Muriel Bowser | Democratic | January 2, 2015 | 1870 (156 yrs) |
| New Orleans, LA | Helena Moreno | Democratic | January 12, 2026 | 1868 (158 yrs) |
St. Louis, Detroit and New Orleans have each changed mayors since a widely-circulated version of this list. Tishaura Jones lost re-election in St. Louis in April 2025 to Cara Spencer. Mike Duggan did not seek another term in Detroit; Mary Sheffield succeeded him January 1, 2026. LaToya Cantrell was term-limited in New Orleans and was separately indicted on federal wire fraud and obstruction charges in August 2025; Helena Moreno succeeded her January 12, 2026. Washington, D.C.'s Muriel Bowser has announced she is not seeking re-election in 2026 but remains in office as of this writing.
* Memphis's and Oakland's last-Republican-mayor dates are approximate, drawn from a secondary compiled source rather than a confirmed primary biography, and should be treated as best estimates rather than exact figures. Chicago (Anton Cermak's 1931 election, per Ballotpedia and Chicago Magazine), St. Louis (Aloys Kaufmann, per Wikipedia), Detroit (Louis Miriani, per Wikipedia), Washington, D.C. (Sayles Jenks Bowen, 1868-1870, per Wikipedia, described as the last Republican mayor of D.C. "or any of its sub-jurisdictions" as of 2025) and New Orleans (Edward Heath, one of only two Republican mayors in the city's entire history, both during Reconstruction) are each confirmed against a specific named individual's documented term.
Who Is Being Arrested? Race, Ethnicity and the Male Factor
Crime rates tell us where reported crime is occurring. FBI arrest statistics provide another piece of the picture: who is being arrested for those offenses.
According to the FBI's 2024 Uniform Crime Reporting data, Black Americans represented a majority of arrests for both murder and robbery. Hispanic or Latino arrestees also represented a substantial share of arrests in several serious-crime categories.
| Offense | Black Share of Arrests | Hispanic/Latino Share of Arrests |
|---|---|---|
| Murder & Nonnegligent Manslaughter | 58.0% | 20.2% |
| Violent Crime — Total | 43.2% | 25.5% |
| Robbery | 57.8% | 27.0% |
| Burglary / Breaking & Entering | 34.3% | 20.2% |
There is another characteristic of these arrest statistics that is even more pronounced: serious-crime arrests are overwhelmingly male.
| Offense | Male Share of Arrests | Female Share |
|---|---|---|
| Murder & Nonnegligent Manslaughter | 88.3% | 11.7% |
| Robbery | 84.9% | 15.1% |
| Burglary / Breaking & Entering | 81.0% | 19.0% |
| Violent Crime — Total | 78.7% | 21.3% |
The murder figure is particularly striking. Of the 9,370 murder arrests reported in the FBI's 2024 sex table, 8,276 involved males.
Nearly nine out of every ten murder arrests were male.
Robbery was not far behind at 84.9%, followed by burglary at 81.0% and violent crime overall at 78.7%.
Whatever else the data may tell us, one thing is difficult to miss: the males are rather busy.
That becomes especially relevant when discussing population shares.
Black Americans constitute about 13.7% of the U.S. population, which means Black males make up roughly 6½ to 7% of the population. Hispanic or Latino Americans constitute about 19.5%, putting Hispanic males at roughly 9½ to 10% of the population.
At the same time, Black Americans accounted for 58.0% of murder arrests and 57.8% of robbery arrests in the 2024 FBI data. Hispanic or Latino arrestees accounted for 20.2% of murder arrests and 27.0% of robbery arrests among arrests for which ethnicity was reported.
Those are substantial disparities.
But there is an important statistical limitation.
The FBI reports race, Hispanic ethnicity and sex in separate distributions. We therefore cannot take the fact that 88.3% of murder arrestees were male and 58.0% were Black and conclude that 88.3% of Black murder arrestees were male. The same problem applies to Hispanic males.
Nor can the Black and Hispanic percentages simply be added together. The FBI treats Black or African American as a race and Hispanic or Latino as an ethnicity. A Hispanic person may also be classified racially as White, Black or another race.
So it would be incorrect to take the 58.0% Black share of murder arrests and the 20.2% Hispanic share and claim that 78.2% of murder arrests were Black or Hispanic.
What the data does allow us to say is significant enough without stretching it:
Black Americans accounted for 58.0% of murder arrests and 57.8% of robbery arrests in the 2024 FBI data. Hispanic or Latino arrestees accounted for 20.2% of murder arrests and 27.0% of robbery arrests for which ethnicity was reported. Meanwhile, 88.3% of all murder arrestees were male.
These numbers describe arrests, not convictions and not a definitive accounting of who committed every crime in America. Some crimes remain unsolved, some are never reported, some never result in an arrest, and an arrest itself is not a finding of guilt.
Even with those limitations, the pattern is difficult to ignore. Serious-crime arrests are not distributed evenly across the population.
Sex may actually be one of the strongest demographic concentrations in the data. Men make up roughly half the population but accounted for 88.3% of murder arrests, 84.9% of robbery arrests, 81.0% of burglary arrests and 78.7% of violent-crime arrests overall.
Race and ethnicity add another layer to that concentration, but they should be interpreted carefully and without pretending the available tables tell us more than they actually do.
That matters to the larger question of whether "America is dangerous."
National averages combine radically different cities, neighborhoods and populations into a single number. The crime problem is not distributed evenly geographically, and the arrest data shows it is not distributed evenly demographically either.
Understanding those concentrations tells us considerably more than simply citing a national crime rate.
Why This Matters
Put the three tables on this page next to each other and a pattern emerges that no single number shows on its own. These are not cities that recently elected new leadership and haven't had time to turn things around. Several have gone longer without a Republican mayor than most Americans have been alive, Chicago since 1931, St. Louis since 1949, Detroit since 1962, and Washington, D.C. and New Orleans since Reconstruction. And across that entire span, the violent crime and murder rates in these same cities have remained dramatically above the national average, not for one election cycle, but for generation after generation of the same party holding the same office.
A fair version of this argument has to concede the obvious counterpoint: a mayor is not the only variable that shapes a city's crime rate. Concentrated poverty, deindustrialization, state-level preemption of local policy, federal funding formulas, historical segregation and decades of population loss all shape outcomes in ways no single office holder controls. Correlation between one-party control and a persistent crime rate is not proof that the party caused the crime rate, and it would be dishonest to claim otherwise.
It is also worth stating plainly who actually pays the price, because the arrest table above only tells half of that story. Arrest data describes offending patterns, not who is being harmed. The Bureau of Justice Statistics' 2023 national report found the Black homicide victimization rate was 21.3 per 100,000, more than six times the white rate of 3.2. That disparity is not evenly spread across the country. The Violence Policy Center's analysis of the same period found Missouri, home to St. Louis, ranked first or second nationally for Black homicide victimization for 16 consecutive years, and Illinois, home to Chicago, had a Black victimization rate of 50.8 per 100,000 in 2022, more than double the already-elevated national figure. Hispanic victimization is also disproportionate, though the cleanest available figure measures firearm homicide specifically rather than homicide overall: a 2020-2024 age-adjusted rate of 4.73 per 100,000, more than double the non-Hispanic white rate of 2.02, a narrower measure than the Black-white comparison and worth keeping distinct rather than treating as directly equivalent.
Put plainly, the people dying at the highest rates in these cities are disproportionately Black men, and to a real if statistically narrower degree Latino men, living under some of the longest uninterrupted single-party governance in the country. That is the actual stakes behind the tables above, not an abstraction about political tenure, but who specifically has borne the cost of it.
But that concession cuts both ways. If a city's problems were simply going to be solved by electing the right people, these cities have had an unusually long, unusually uninterrupted opportunity to prove it. Decades of continuity is not the argument against local leadership mattering. It is the condition under which leadership gets the clearest possible test, no divided government, no opposing party to blame for gridlock, no interruption long enough to argue the previous administration's mess was never fully cleaned up. The same party has had the wheel, in some of these cities, for longer than the interstate highway system has existed.
Residents did not fail their cities. They kept voting the way their cities had always voted. The question this page actually raises is whether that vote has been rewarded with results, or simply renewed on faith.
References
- Federal Bureau of Investigation. Crime in the United States, 2019, Table 1 and Table 2. ucr.fbi.gov. [National 2019 murder rate, 5.0 per 100,000; national violent crime rate, 366.7-379.4 per 100,000 depending on measure.]
- CBS News. (2020, November 9). The Most Dangerous Cities in America, Ranked. cbsnews.com. [2019 murder counts and violent crime rates for Memphis, St. Louis, Oakland and New Orleans.]
- Chicago Sun-Times. (2020, November 22). Chicago Hits 700-Homicide Mark. [2019 Chicago homicide count of 503, cited for year-over-year comparison.]
- Wikipedia. Crime in Louisiana. en.wikipedia.org. [New Orleans 2019 murder count and rate.]
- Wikipedia. Crime in Detroit. en.wikipedia.org. [Detroit murder and violent crime rate figures.]
- Wikipedia. List of Mayors of the 50 Largest Cities in the United States; Brandon Johnson; Mary Sheffield; Mike Duggan; Helena Moreno; LaToya Cantrell. en.wikipedia.org. [Current mayors and transition dates.]
- Ballotpedia. LaToya Cantrell. ballotpedia.org. [August 2025 federal indictment on wire fraud and obstruction charges.]
- Wikipedia. 2025 St. Louis Mayoral Election; 2025 New Orleans Mayoral Election. en.wikipedia.org.
- Ballotpedia. History of Chicago's Mayoral Office (1837-2019). ballotpedia.org. [Anton Cermak's 1931 election as the start of unbroken Democratic control.]
- Chicago Magazine. (2025, October). Has Chicago Ever Had a Republican Mayor? chicagomag.com.
- Wikipedia. Aloys P. Kaufmann; Louis Miriani; Sayles Jenks Bowen; Edward Heath (New Orleans). en.wikipedia.org. [Last Republican mayors of St. Louis, Detroit, Washington D.C. and New Orleans, respectively.]
Disclaimer: This page presents publicly available statistical data and the author's own calculations for reference purposes, clearly marked where derived rather than directly reported. It does not represent the positions of any institution, employer, organization or affiliated entity with which the author may be associated in any capacity. Readers are encouraged to consult the FBI's primary Table 8 city-level data directly for figures this page could not confirm.