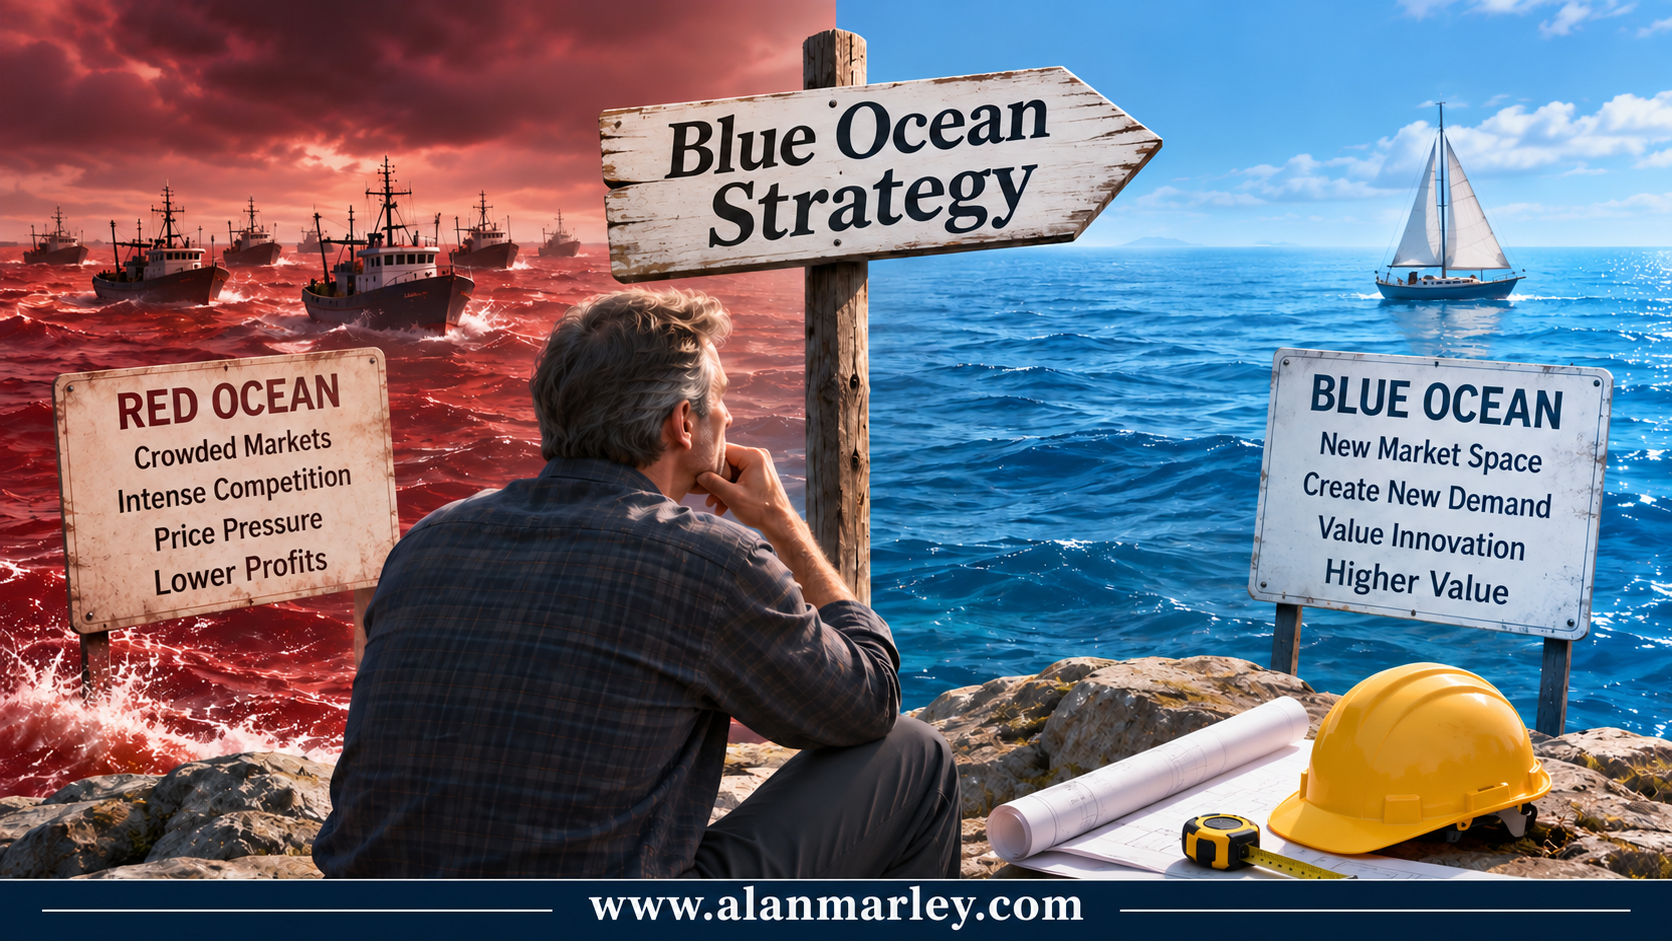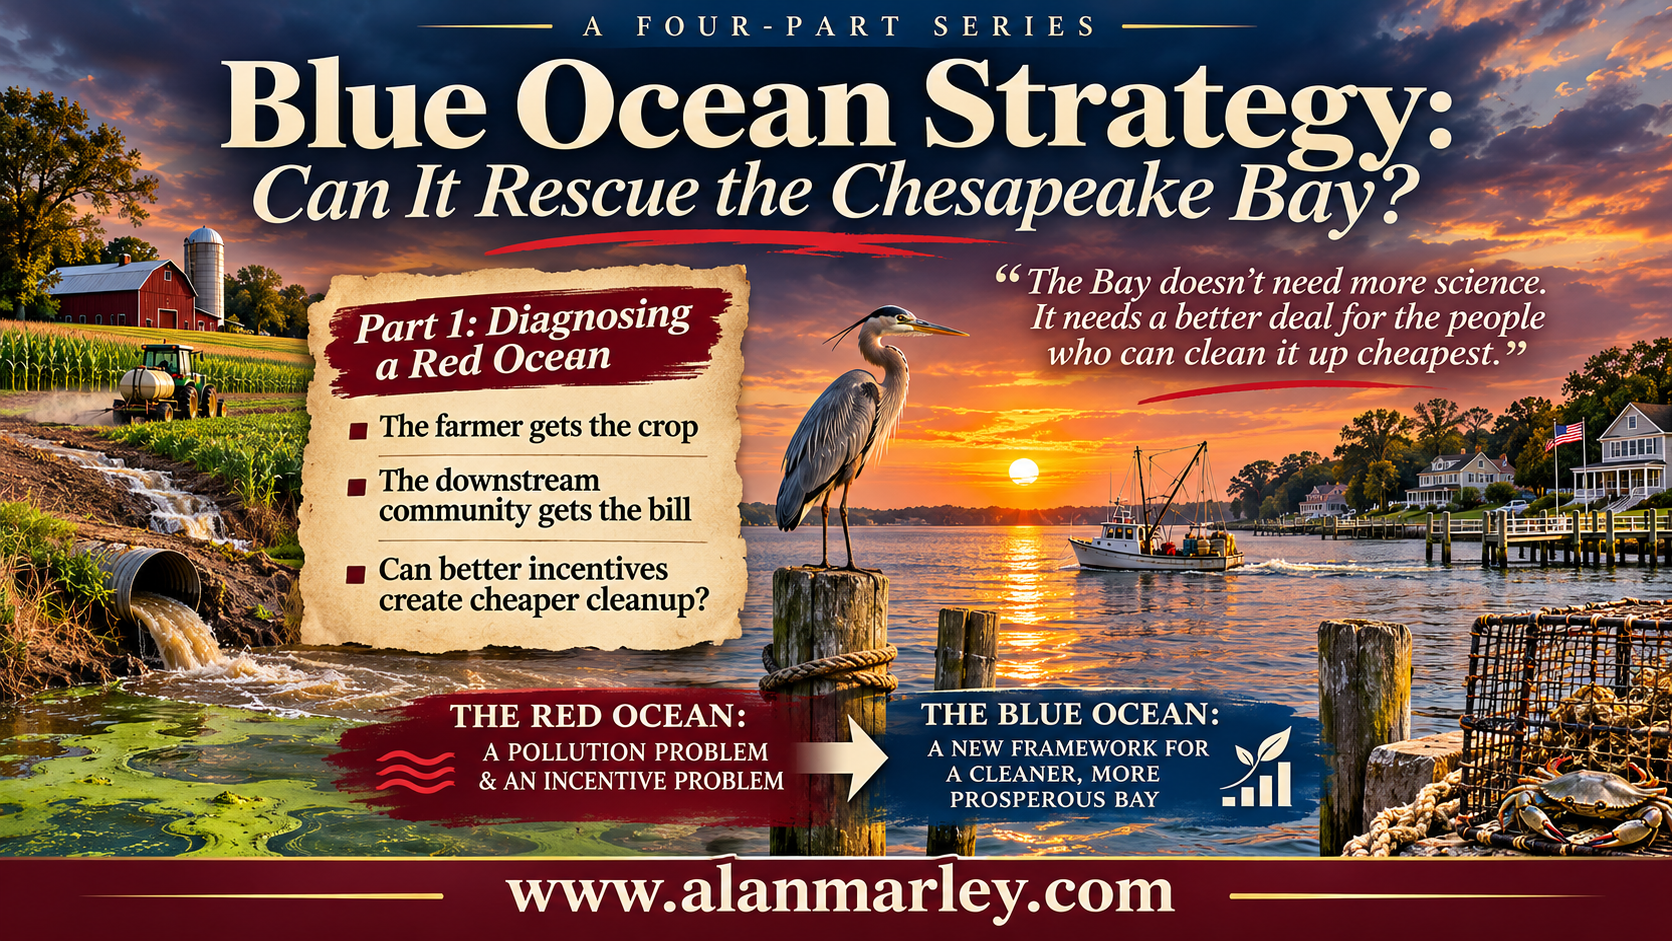
Blue Ocean Strategy makes a bold promise: stop fighting rivals in a crowded market and create new market space where the competition does not matter. [8] I have taught the framework, and I am skeptical of it as an operating manual, especially for small firms in established industries. But a framework does not have to be a guarantee to be useful. It can be a disciplined way to generate options. That is how I use it in this series, on a problem far from any business school case: the pollution in the Chesapeake Bay.
This is the first of four posts. This one diagnoses the problem as a red ocean. The second builds a blue ocean alternative, a market for pollution credits, and tests it with a simple example. The third asks what the Bay is worth, so we can judge whether any alternative deserves its cost. The fourth, my final project, compares the options and makes a recommendation.
The Bay in Brief
The Bay has been the subject of cleanup promises for more than forty years, starting with the first Chesapeake Bay Agreement in 1983. [3] In December 2010 the Environmental Protection Agency stopped promising and set a number. It capped the annual load at 185.9 million pounds of nitrogen, 12.5 million pounds of phosphorus and 6.45 billion pounds of sediment across a watershed of about 64,000 square miles in six states and the District of Columbia. [14]
The target year for having all controls in place was 2025. In September 2026 EPA released its 2025 progress assessment and said the restoration is “not finished,” calling for continued investment, particularly in agriculture and developed areas. [15] Pennsylvania’s 2019 plan did not fully meet its nitrogen target, and EPA said further changes were needed. [15] Sixteen years after the cap, the program has a number, a deadline and a shortfall.
Why the Problem Persists
Start with who pays. A farmer who spreads fertilizer gets the crop. A waterman, a marina owner or a family with a waterfront home downstream gets part of the bill in algal blooms, murky water and low oxygen. The private cost of producing is lower than the social cost, so the market delivers more pollution than is socially efficient. [4]
The farmer gets the crop. The downstream community gets the bill.
The cap did not fix that, and the results show where it bites. Wastewater plants met their 2025 nutrient limits about ten years early, according to EPA, after cutting nitrogen 57 percent and phosphorus 75 percent since 1985. [15] A plant is a point source. Its discharge leaves through a pipe, and a regulator can measure it and write a permit.
Farms are different. Runoff from fields is nonpoint pollution, created by many dispersed decisions about fertilizer, manure and soil. No pipe exists to measure. Regulators cannot observe each farm’s loads or its cost of cutting them, and a farmer has every reason to overstate that cost. [4] At the 2018 midpoint the partnership had beaten its halfway goals for phosphorus and sediment and missed the nitrogen target by 15 million pounds. [2]
The Red Ocean on One Page
In Blue Ocean terms, a red ocean is an industry where everyone competes on the same factors, fighting over the same demand with the same rules. Kim and Mauborgne draw a strategy canvas to show it, a chart of what an industry offers and what it leaves out. [8] The Bay has no competitors, but it has a standard way of working, and it can be read the same way. Here is my read of it, based on the record above:
| Competes on | Leaves out |
|---|---|
| Cost of meeting a limit at each source | A price signal for cutting beyond the limit |
| What a regulator can measure and write into a permit | The cheapest cut, wherever it happens to be |
| The same rule for similar sources | Any reward for finding a cheaper way |
| Meeting the deadline | What the cleanup is worth to the public |
Every source is asked to do roughly the same thing and is judged on how cheaply and visibly it complies. Nobody is rewarded for being good at cleanup, and nobody has a reason to find a cheaper way. Where the pollution comes from a pipe, that works. Where it comes from a field, it does not.
Four Questions for the Bay
The Blue Ocean toolkit has a simple device for leaving a red ocean: four questions known as Eliminate, Reduce, Raise and Create. [8] Asked of the Bay, they look like this:
| Question | What it asks here |
|---|---|
| Eliminate | Which assumptions can go? Must every source cut by the same share? Must the regulator know each source's costs? |
| Reduce | What can come down? The total cost of meeting the cap, and the information burden on regulators |
| Raise | What should go up? Flexibility for sources, rewards for cheap cleanup and the incentive to innovate |
| Create | What does not exist yet? A way to buy and sell a pound of pollution reduction |
The answers lead to different alternatives. Part 2 takes the most developed one, a market for pollution credits, and tests it with a simple example. Part 3 asks how to judge the alternatives by what the Bay is worth. Part 4 compares them.
Before reading Part 2, build your own grid. List three assumptions in the current approach that you would eliminate or reduce, and one thing you would raise or create. Then ask what each change would require of regulators, of farmers and of the people downstream.
Where Blue Ocean Helps and Where It Stops
The framework gave us a better set of questions than “how do we make everyone comply more cheaply?” That is its real value here. It does not say which answer is right. A good list of alternatives still has to be tested against costs, evidence and the law, and a market created by regulators can be taken away by them. That is the work of the next three posts.
- Chesapeake Bay Program. (2018, July 30). Halfway to 2025: EPA releases results of Chesapeake Bay pollution diet check-in. chesapeakebay.net/news/blog/halfway-to-2025-epa-releases-results-of-chesapeake-bay-pollution-diet-check
- Chesapeake Bay Program. (n.d.). 1983: The first Chesapeake Bay Agreement is signed. 40years.chesapeakebay.net
- Field, B. C., & Field, M. K. (2024). Environmental economics: An introduction. McGraw Hill.
- Kim, W. C., & Mauborgne, R. (2005). Blue ocean strategy: How to create uncontested market space and make the competition irrelevant. Harvard Business School Press.
- U.S. Environmental Protection Agency. (2010, December 29). Chesapeake Bay total maximum daily load for nitrogen, phosphorus and sediment. epa.gov/chesapeake-bay-tmdl
- U.S. Environmental Protection Agency. (2026, September 14). Key developments in the Chesapeake Bay watershed. epa.gov/chesapeake-bay-tmdl/key-developments-chesapeake-bay-watershed